
|
|
[ Home ][ Suspension Types ] [ Tutorials ][ Data files ] [ FAQ ] [ Purchase here ] [ Contact us ][ Join The Mailing List ][ Download SusProg3D ] [ SusProg3D Evaluation CD ]
Using Excel to graph SusProg3D data
![]()
This tutorial demonstrates a method for displaying multiple SusProg3D calculated data items graphically.
You will need SusProg3D V4.91(or later) and Excel97 (or later)
This tutorial uses the Nascar demo file, but you can use your own data.
Start SusProg3D, and open the demo file, Nascar.s3d
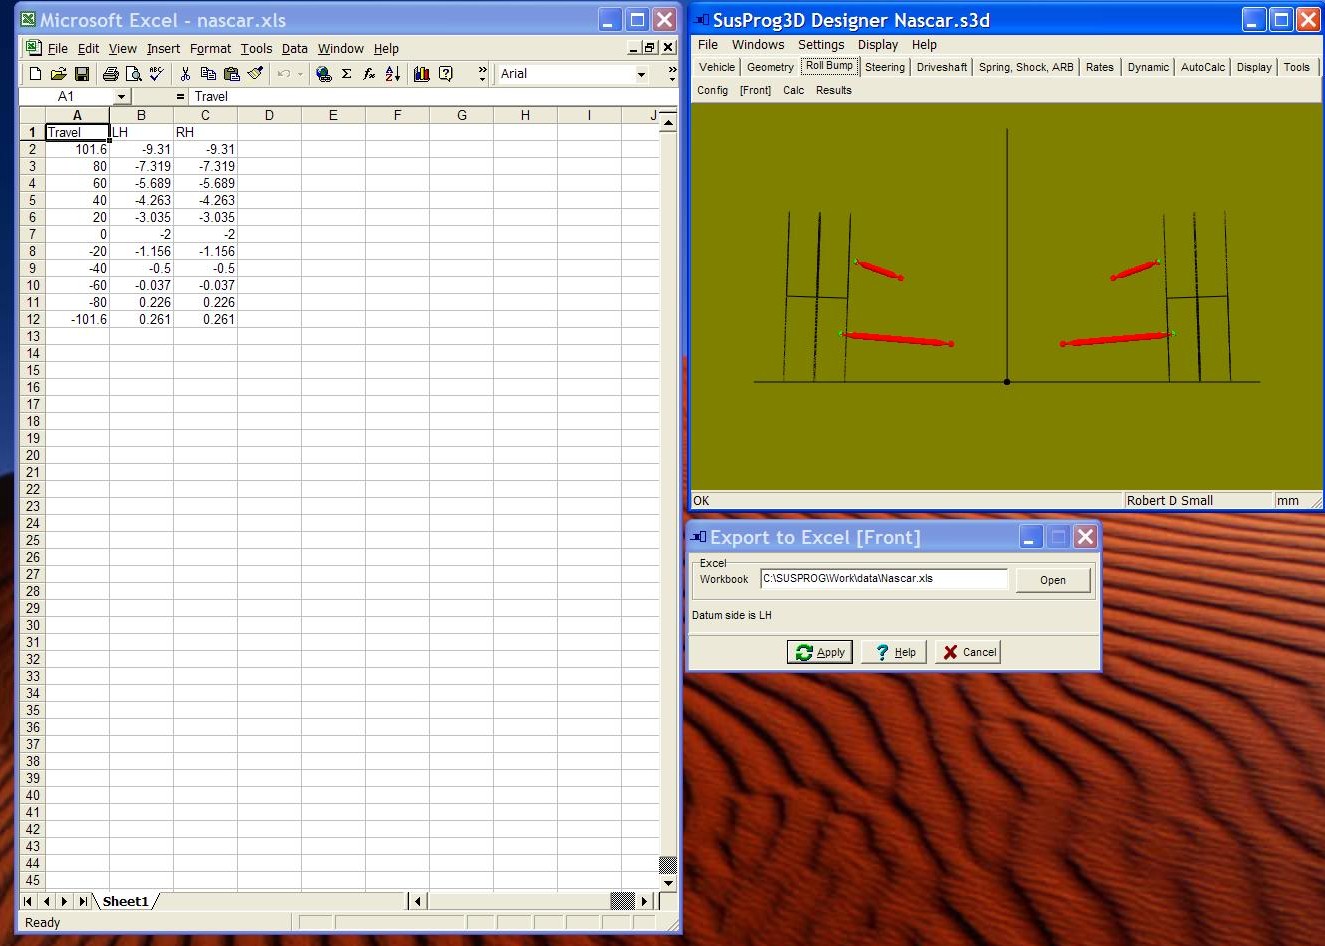
Go to Roll&Bump. Make sure that you are using [Front], and then do a Roll&Bump Calc.
Your screen should now look something like this.
Go to the Tools tab, and then Calc2Excel. This will open the "Export calculated data to Excel" dialog.
If the number of calculated data points is greater than the Excel range, then all Excel cells will be blank, so make sure that the Excel range size matches the Roll&Bump calculation range.
The required number of cells is shown in the "Export calculated data to Excel" dialog. For the bump steer graph we only need the Front bump and droop data points.
Start Excel. It will open with Book1 and Sheet1.
Add some text to cell A1, "Travel", B1 "LH" and C1 "RH"
This tutorial assumes 11 data points in bump and droop. If you have more data points, then increase the range of cells by the appropriate number in the following instructions.
For example, if you have 21 data points then A12 will become A22, B12 will become B22, etc.
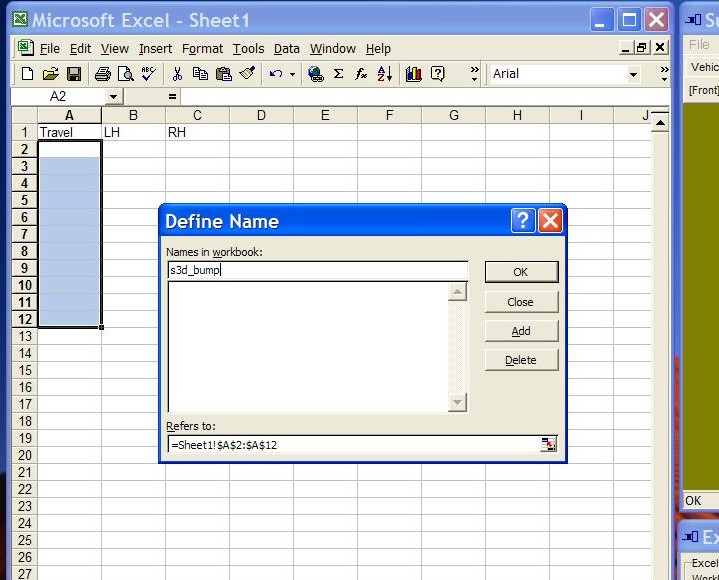
Select a the block of cells A2 to A12. Then go to Insert -> Name -> Define, and name this group as S3D_BUMP, then "OK"
Repeat with a second block of cells, B2 to B12, and name as S3D_CAMBER_LH
Repeat with a third block of cells, C2 to C12, and name as S3D_CAMBER_RH
Back to SusProg3D, and close and reopen the "Export calculated data to Excel" dialog.
Because Excel was open, SusProg3D will connect to the currently open workbook. If you had closed Excel before doing the Calc, you will need to use the Open button to open the required workbook.
Leave it open, don't close the dialog as this is the connection between SusProg3D and Excel.
Go back to the Roll&Bump tab, and Calc.
The three blocks of cells have been updated with the travel and camber values.
Now, back to Excel.
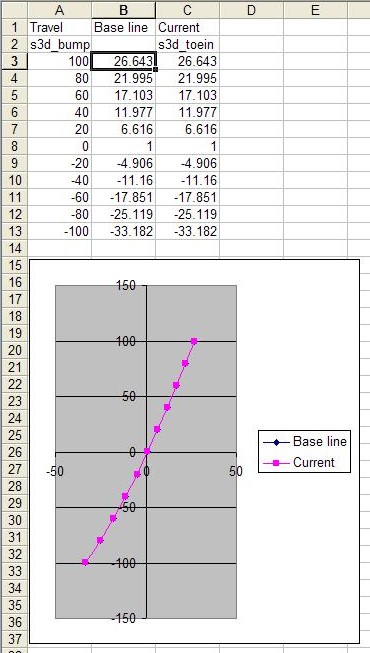
Highlight the cells A2 to C12, then go to Insert -> Chart. Choose the chart type "XY (Scatter)" and the subtype "Scatter with data points connected by smoothed lines".
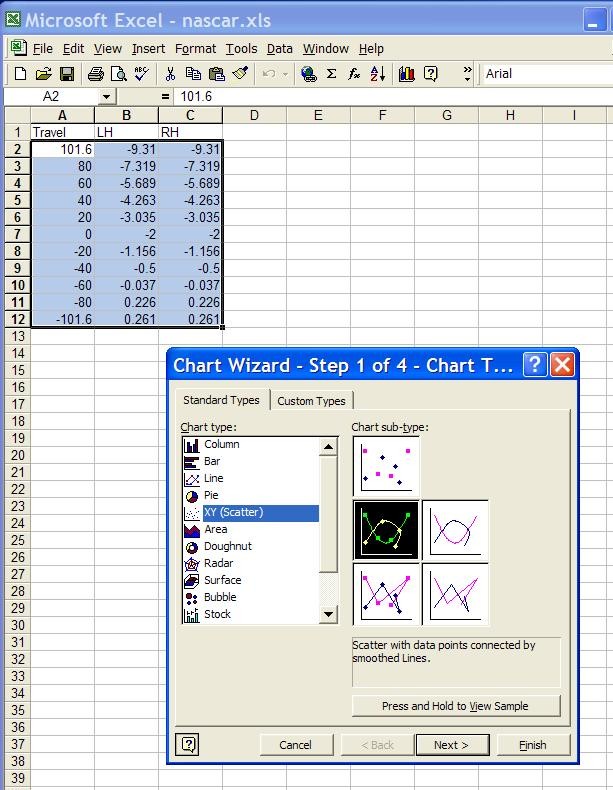
Click on "Next".
In the "Data Range" tab, the data range should be =Sheet1!$A$2$C$12, series should be "Columns" .
In the "Series" tab, highlight Series1, and change the X values to =Sheet1!$B$2$B$12 and the Y values to =Sheet1!$A$2$A$12.
Highlight Series2, and change the to X values to =Sheet1!$C$2$C$12 and the Y values to =Sheet1!$A$2$A$12.
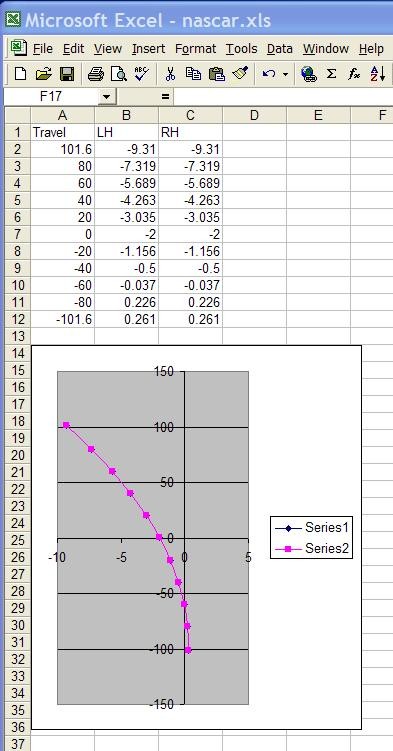
Click on "Finish".
You should now have a graph showing the LH and RH wheel camber curves. Because they are the same, you only see one.
Now we will change the static camber of the LH wheel (and make it different to the RH wheel).
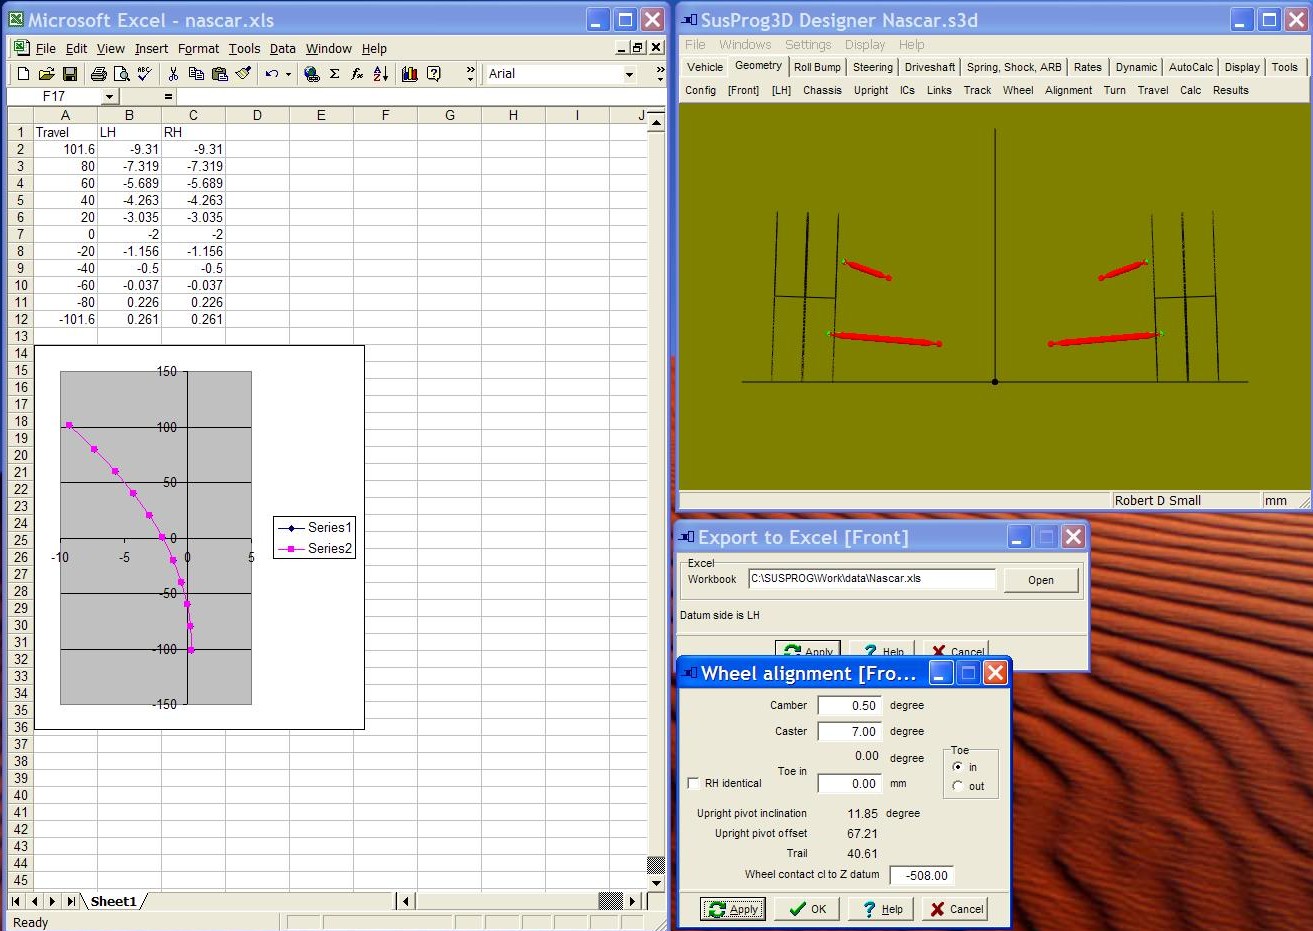
Go back to SusProg3D, and go to Geometry. Make sure it is [Front] and [LH]. Then Alignment.
Change the Camber to 0.5 and "untick" the "RH identical", then "Apply". This will leave the RH camber at the original setting and change the LH camber to the new setting. Do not close the dialog, just move it out of the way if you wish.
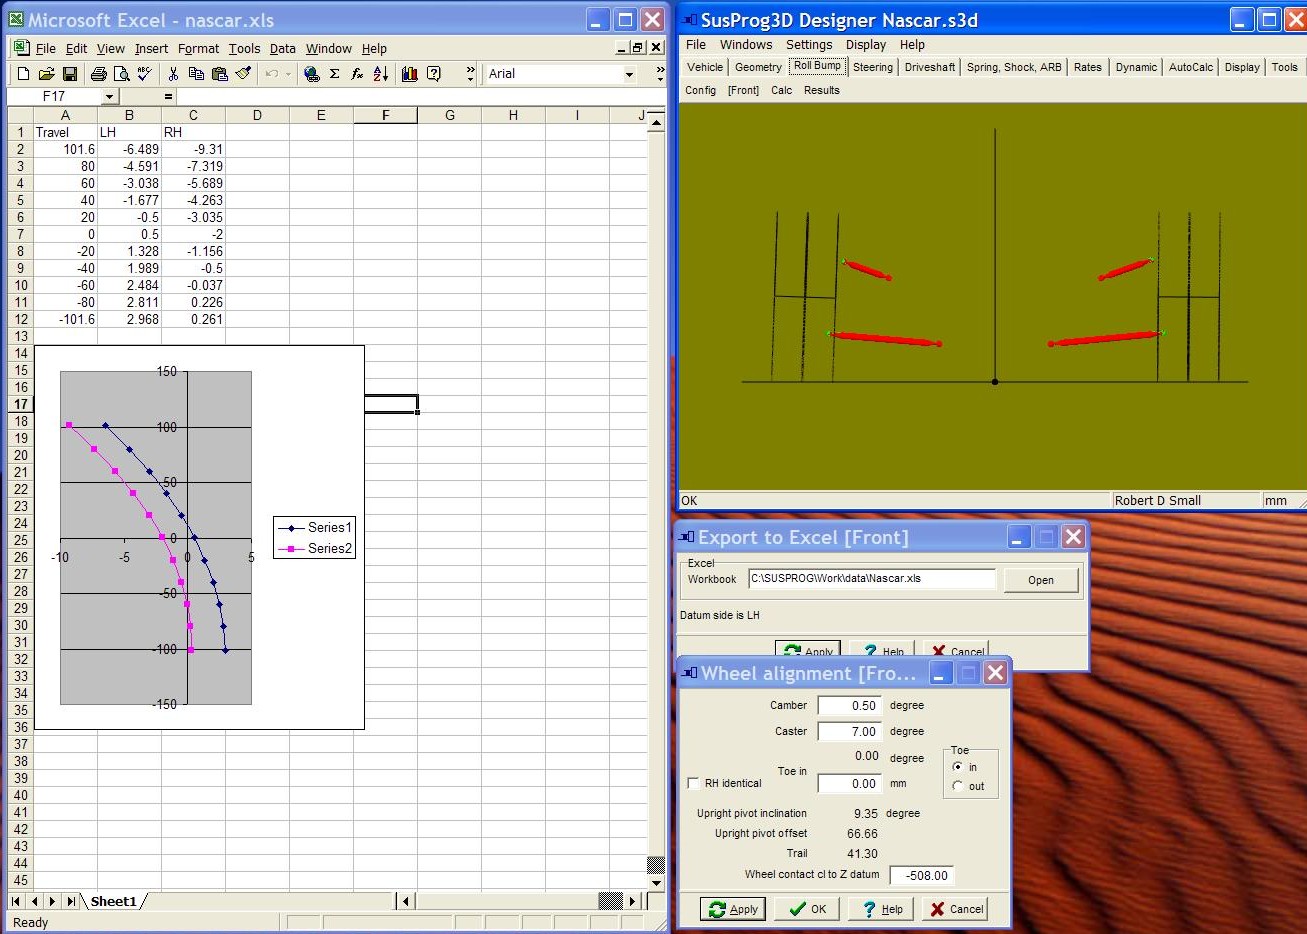
Now go to Roll&Bump and Calc. The graph will update, and you will see the two curves. Also, because the Alignment dialog was left open, it has also updated with the calculated values. And, of course, the display has also updated
|
JOIN
the SusProg3D
Mailing List and be kept informed on the latest developments
We DO NOT
sell, hire or loan names and address to other organizations My
Privacy Policy
 © 2012 Beven D Young All rights reserved


This page was last modified: